本贴仅记录笔者学习过程与经验分享,非教程。
csdiy是一个北大老哥整理的一套非常完整的cs自学体系。近期突然想重新看一下这部分内容以补齐本科欠的债…
笔者使用操作系统为fedora39.
本贴仅记录笔者学习过程与经验分享,非教程。
csdiy是一个北大老哥整理的一套非常完整的cs自学体系。近期突然想重新看一下这部分内容以补齐本科欠的债…
笔者使用操作系统为fedora39.
QEMU运行XV6.
按照教程走,缺啥补啥。
官方没有给出fedora的补齐依赖指令。如果你使用的发行版也是fedora,使用下列命令下载依赖
sudo dnf install gcc-riscv64-linux-gnu qemu-system-riscv
运行make qemu, 报错
ser/sh.c: In function ‘runcmd’:
user/sh.c:58:1: error: infinite recursion detected [-Werror=infinite-recursion]
   58 | runcmd(struct cmd *cmd)
      | ^~~~~~
user/sh.c:89:5: note: recursive call
   89 |     runcmd(rcmd->cmd);
      |     ^~~~~~~~~~~~~~~~~
user/sh.c:109:7: note: recursive call
  109 |       runcmd(pcmd->left);
      |       ^~~~~~~~~~~~~~~~~~
user/sh.c:116:7: note: recursive call
  116 |       runcmd(pcmd->right);
      |       ^~~~~~~~~~~~~~~~~~~
user/sh.c:95:7: note: recursive call
   95 |       runcmd(lcmd->left);
      |       ^~~~~~~~~~~~~~~~~~
user/sh.c:97:5: note: recursive call
   97 |     runcmd(lcmd->right);
      |     ^~~~~~~~~~~~~~~~~~~
user/sh.c:127:7: note: recursive call
  127 |       runcmd(bcmd->cmd);
      |       ^~~~~~~~~~~~~~~~~
cc1: all warnings being treated as errors
make: *** [<builtin>: user/sh.o] Error 1
根据该issue尝试解决。补齐依赖后即可进入xv6 shell.
[unclebiglu@ublvlc xv6-labs-2021]$ make qemu
qemu-system-riscv64 -machine virt -bios none -kernel kernel/kernel -m 128M -smp 3 -nographic -drive file=fs.img,if=none,format=raw,id=x0 -device virtio-blk-device,drive=x0,bus=virtio-mmio-bus.0

xv6 kernel is booting

hart 1 starting
hart 2 starting
init: starting sh
$ ls
.              1 1 1024
..             1 1 1024
README         2 2 2226
xargstest.sh   2 3 93
cat            2 4 24208
echo           2 5 23056
forktest       2 6 13512
grep           2 7 27416
init           2 8 23808
kill           2 9 22960
ln             2 10 22816
ls             2 11 26544
mkdir          2 12 23064
rm             2 13 23056
sh             2 14 41256
stressfs       2 15 24040
usertests      2 16 151768
grind          2 17 38104
wc             2 18 25200
zombie         2 19 22312
console        3 20 0
按 ctrl a x 即可退出。
刚好也准备学6.S081!!!持续追更!!
wow , 更进更进! 在此帖子后面更进出一些RISCV 特权架构级别的东西,和 XV6 的源码解析
本节实验大部分是实现Unix系统上的一些常用功能,难度并不高。注意一楼给的github老哥实现里面有些bug,参考的话需要注意一下。
尝试按照老师的操作使用gdb调试xv6. 我没有在找到fedora下可以直接用的rv64 gdb, 因此选择从源码编译。
根据readme 编译即可。
没有看明白他的newLib版本和linux版本有什么区别…有懂的佬可以指点一下吗
之后即尝试进入gdb环境。首先启动qemu gdb
cd xv6-labs-2021
make CPUS=1 qemu-gdb
之后在另一个窗口中运行gdb
./bin/riscv64-unknown-linux-gnu-gdb
xv6-labs-2021]$ ../../../../riscv-gnu-toolchain/build/bin/riscv64-unknown-linux-gnu-gdb
GNU gdb (GDB) 14.1
Copyright (C) 2023 Free Software Foundation, Inc.
License GPLv3+: GNU GPL version 3 or later <http://gnu.org/licenses/gpl.html>
This is free software: you are free to change and redistribute it.
There is NO WARRANTY, to the extent permitted by law.
Type "show copying" and "show warranty" for details.
This GDB was configured as "--host=x86_64-pc-linux-gnu --target=riscv64-unknown-linux-gnu".
Type "show configuration" for configuration details.
For bug reporting instructions, please see:
<https://www.gnu.org/software/gdb/bugs/>.
Find the GDB manual and other documentation resources online at:
    <http://www.gnu.org/software/gdb/documentation/>.

For help, type "help".
Type "apropos word" to search for commands related to "word".
warning: File "/home/unclebiglu/Documents/repostories/csdiy/s081os/lab1/xv6-labs-2021/.gdbinit" auto-loading has been declined by your `auto-load safe-path' set to "$debugdir:$datadir/auto-load".
To enable execution of this file add
        add-auto-load-safe-path /home/unclebiglu/Documents/repostories/csdiy/s081os/lab1/xv6-labs-2021/.gdbinit
line to your configuration file "/home/unclebiglu/.config/gdb/gdbinit".
To completely disable this security protection add
        set auto-load safe-path /
line to your configuration file "/home/unclebiglu/.config/gdb/gdbinit".
For more information about this security protection see the
"Auto-loading safe path" section in the GDB manual.  E.g., run from the shell:
        info "(gdb)Auto-loading safe path"
(gdb) set confirm off
(gdb) set architecture riscv:rv64
The target architecture is set to "riscv:rv64".
(gdb) target remote 127.0.0.1:26000
Remote debugging using 127.0.0.1:26000
warning: No executable has been specified and target does not support
determining executable automatically.  Try using the "file" command.
0x0000000000001000 in ?? ()
(gdb) symbol-file kernel/kernel
Reading symbols from kernel/kernel...
(gdb) set disassemble-next-line auto
(gdb) set riscv use-compressed-breakpoints yes
(gdb) b _entry
Breakpoint 1 at 0x8000000a
xv6仓库下面有一个.gdbinit的文件给了如何进行gdb的指令,我这里直接一条一条手动执行了…应该也有方法自动读这个文件。之后即可设置断点进行调试。
发现编译的gdb不支持tui,但是找到了个方便的脚本用python提供一些功能
─── Output/messages ─────────────────────────────────────────────────────────────────────────────────────────────────────────────────

Breakpoint 1, 0x000000008000000a in _entry ()
=> 0x000000008000000a <_entry+10>:      f14025f3                csrr    a1,mhartid
─── Assembly ────────────────────────────────────────────────────────────────────────────────────────────────────────────────────────
!0x000000008000000a  ? csrr     a1,mhartid
 0x000000008000000e  ? addi     a1,a1,1
 0x0000000080000010  ? mul      a0,a0,a1
 0x0000000080000014  ? add      sp,sp,a0
 0x0000000080000016  ? jal      0x8000574e <start>
 0x000000008000001a  ? j        0x8000001a <spin>
 0x000000008000001c  ? addi     sp,sp,-32
 0x000000008000001e  ? sd       ra,24(sp)
 0x0000000080000020  ? sd       s0,16(sp)
 0x0000000080000022  ? sd       s1,8(sp)
─── Breakpoints ─────────────────────────────────────────────────────────────────────────────────────────────────────────────────────
[1] break at 0x000000008000000a for _entry hit 1 time
─── Expressions ─────────────────────────────────────────────────────────────────────────────────────────────────────────────────────
─── History ─────────────────────────────────────────────────────────────────────────────────────────────────────────────────────────
─── Memory ──────────────────────────────────────────────────────────────────────────────────────────────────────────────────────────
─── Registers ───────────────────────────────────────────────────────────────────────────────────────────────────────────────────────
    zero 0x0000000000000000     ra 0x0000000000000000     sp 0x0000000080021140    gp 0x0000000000000000    tp 0x0000000000000000
      t0 0x0000000080000000     t1 0x0000000000000000     t2 0x0000000000000000    fp 0x0000000000000000    s1 0x0000000000000000
      a0 0x0000000000001000     a1 0x0000000087e00000     a2 0x0000000000001028    a3 0x0000000000000000    a4 0x0000000000000000
      a5 0x0000000000000000     a6 0x0000000000000000     a7 0x0000000000000000    s2 0x0000000000000000    s3 0x0000000000000000
      s4 0x0000000000000000     s5 0x0000000000000000     s6 0x0000000000000000    s7 0x0000000000000000    s8 0x0000000000000000
      s9 0x0000000000000000    s10 0x0000000000000000    s11 0x0000000000000000    t3 0x0000000000000000    t4 0x0000000000000000
      t5 0x0000000000000000     t6 0x0000000000000000     pc 0x000000008000000a
─── Source ──────────────────────────────────────────────────────────────────────────────────────────────────────────────────────────
─── Stack ───────────────────────────────────────────────────────────────────────────────────────────────────────────────────────────
[0] from 0x000000008000000a in _entry
─── Threads ─────────────────────────────────────────────────────────────────────────────────────────────────────────────────────────
[1] id 1 from 0x000000008000000a in _entry
─── Variables ───────────────────────────────────────────────────────────────────────────────────────────────────────────────────────
─────────────────────────────────────────────────────────────────────────────────────────────────────────────────────────────────────
>>>
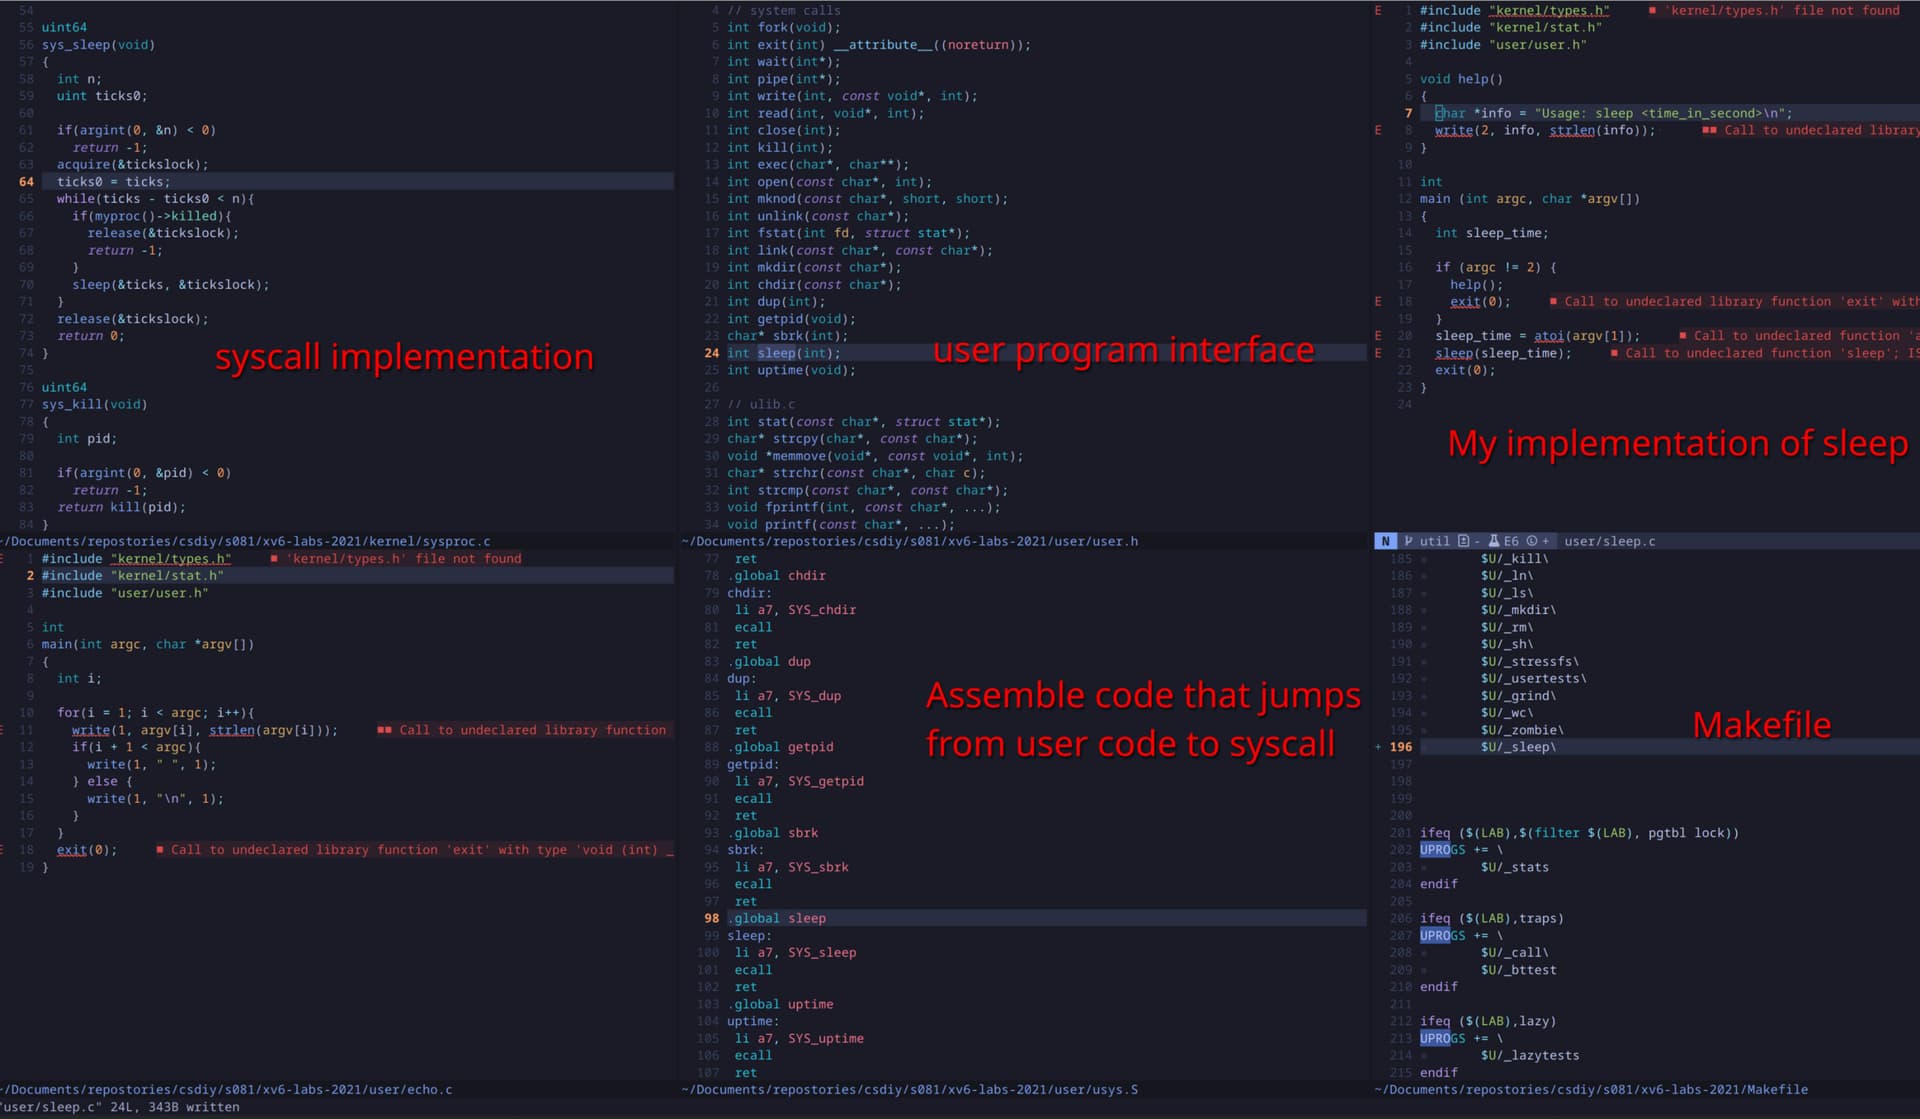
memlayout.h Physical memory layout
proc_pagetable Map phisical memory to vaddr;
不要忘记在proc_freepagetable 里面把usyscall的page unmap掉
首先还是观察输出格式,以及各个字段含义。
pa: 观察到在walk函数里有pagetable = (pagetable_t)PTE2PA(*pte); 用法,将PTE映射为下一级页表地址,因此可推知pa为pageaddress。
顺便看一眼PTE2PA的实现:
#define PTE2PA(pte) (((pte) >> 10) << 12)
PTE最右侧10位为flag,RV64物理内存地址为56bit,其中44bit为PPN(Physical Page Number), 剩下12bit为offset, 继承自虚拟内存。因此此处通过两次位移获得二级页表物理内存地址。之后可以根据虚拟内存中的中间9bit在该页表中索引到一条PTE(Page table entry).
话说印象里记得在哪里看过Linux kernel 是禁止递归的,但是这边XV6的代码里还是有递归实现,是我记错了还是说这两个东西区别蛮大的(?
取得当前进程page table, walk 获取PTE, 从当前PTE遍历足量offset判断标志位是否置1,之后把结果copyout到user即可。当然这个offset最好能判断一下有没有越界…
newlib glibc uclibc musl都是不同的libc实现,和编译器工具链是紧密耦合的,但也会有裸机工具链这里会是none。编译os的时候哪个都可以用,因为不依赖任何libc,但是在已经配置好的os上编译用户态软件的时候需要对应选正确的工具链
返回函数调用栈。首先读fp寄存器获得当前调用栈地址,之后根据固定偏移量读取函数返回地址以及上一层调用栈的fp值,之后循环即可。XV6会给每个栈分配一个page,因此循环结束条件我这里设置的是fp值大于栈底地址。
本实验要求从内核中断周期性调用用户态callback。
向XV6增加一个新特性,使得系统在某个进程占用CPU时间时周期性向其发送alert。
增加一个新的系统调用sigalarm(interval, handler), 用于注册一个回调函数,cpu每经过interval个tick后调用callback一次。callback返回时应从程序之前中断位置继续向下执行。本实验中callback函数会被强制要求手动调用sigreturn()系统调用来返回中断位置。
从内核态返回到用户态时,PC指针会从trapframe的epc字段读取,因此修改这一字段即可修改从内核态返回到用户态时的程序执行地址。将epc直接改为callback函数的地址即可实现调用callback函数,但目前状态无法从callback正常恢复到原始程序中断位置。
直接保存整个trapframe是不可取的。trapframe中包含部分进入trap时需要的信息,如kernel stack等,该部分信息会在usertrapret()中进行更新,若在恢复trapframe时对该部分内容进行覆盖将会导致内核行为发生错误,因此应当仅恢复除去该部分信息以外的全部其它寄存器。
目前有一点没有搞懂,在我的理解里callee寄存器,如sp等,在函数调用前后应当不会改变,不对该类型寄存器进行恢复应当是可取的,但实际测试下来不恢复该类寄存器同样会导致程序出错。暂时没有搞懂原因。有关caller register 和callee register的简要介绍可参考该stackoverflow
https://stackoverflow.com/questions/9268586/what-are-callee-and-caller-saved-registers
首先修改uvmcopy使其不再复制物理内存,而是将新PTE指向老物理内存。
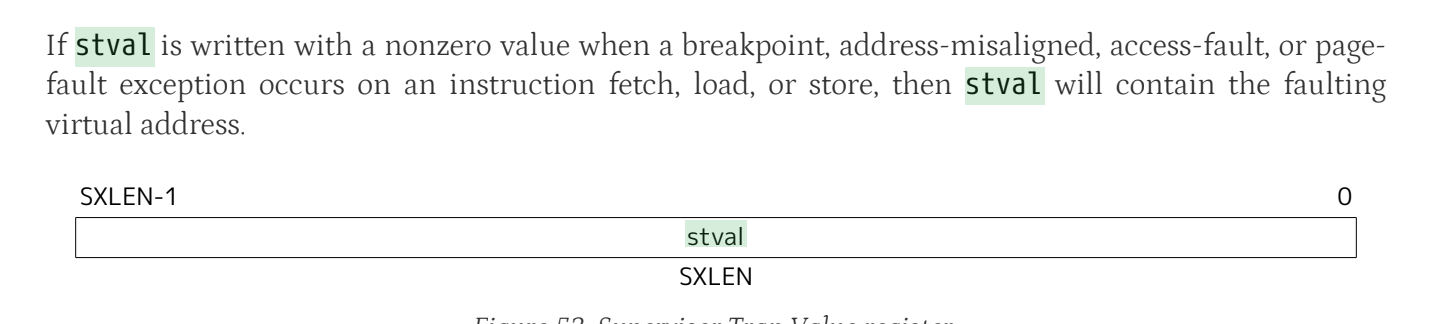
根据RV文档,发生page fault 时stval寄存器中会保存发生错误的虚拟地址。
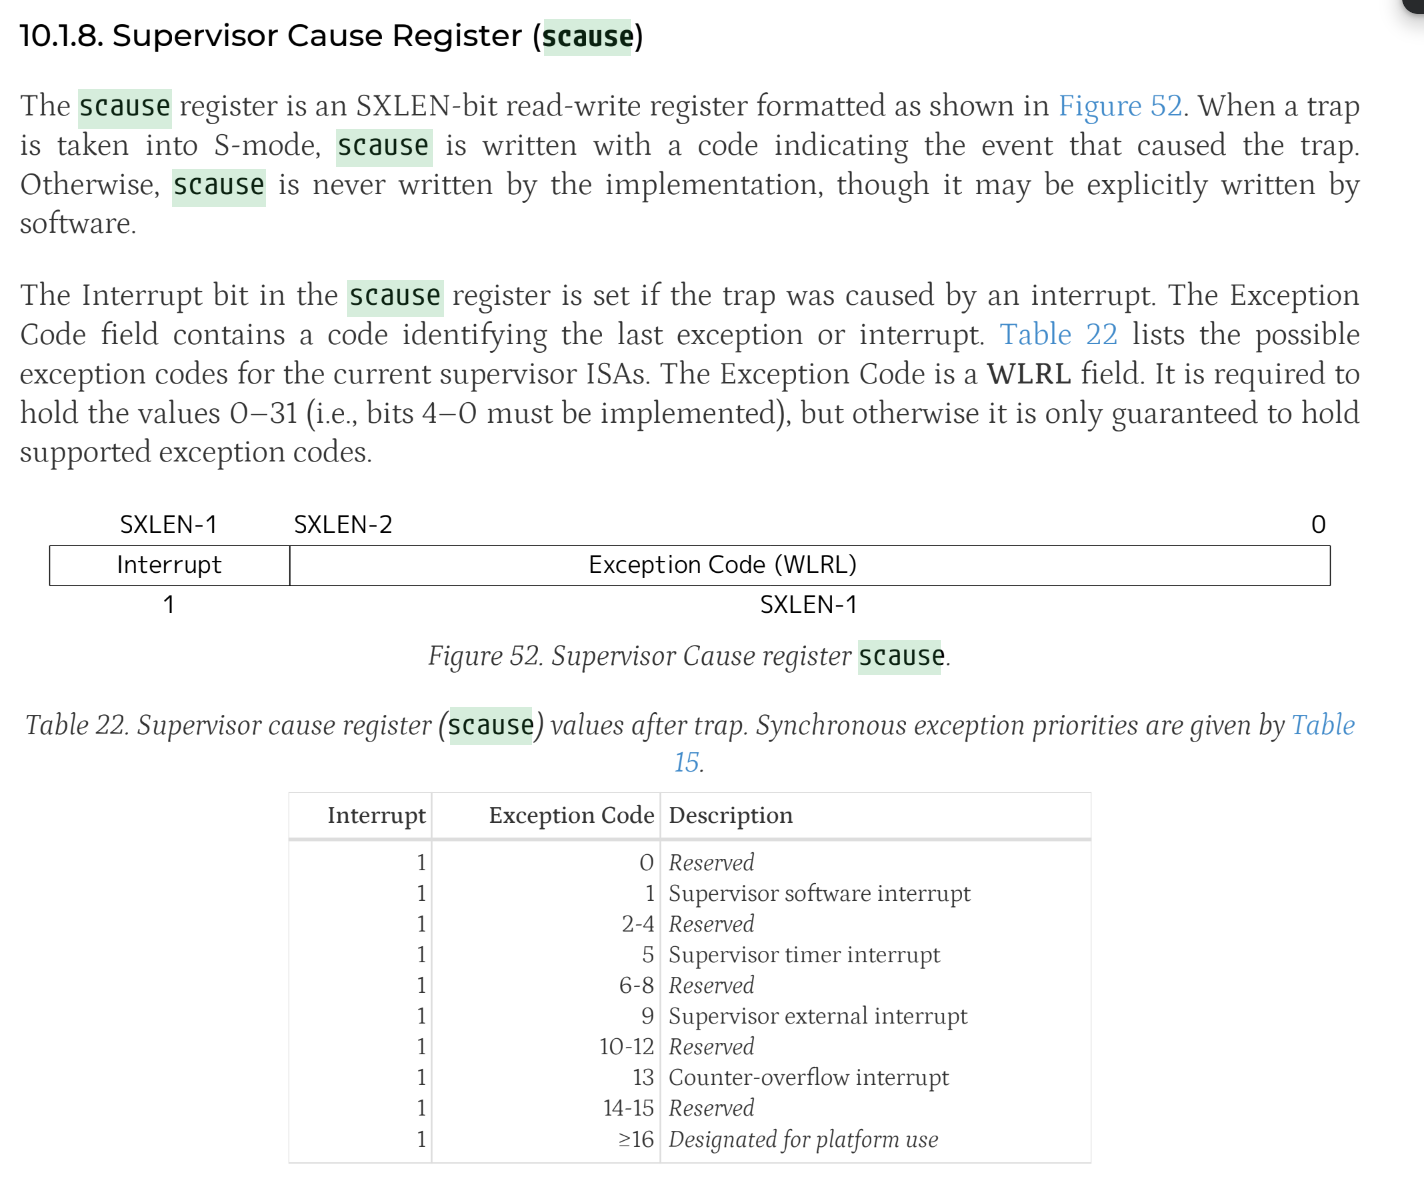
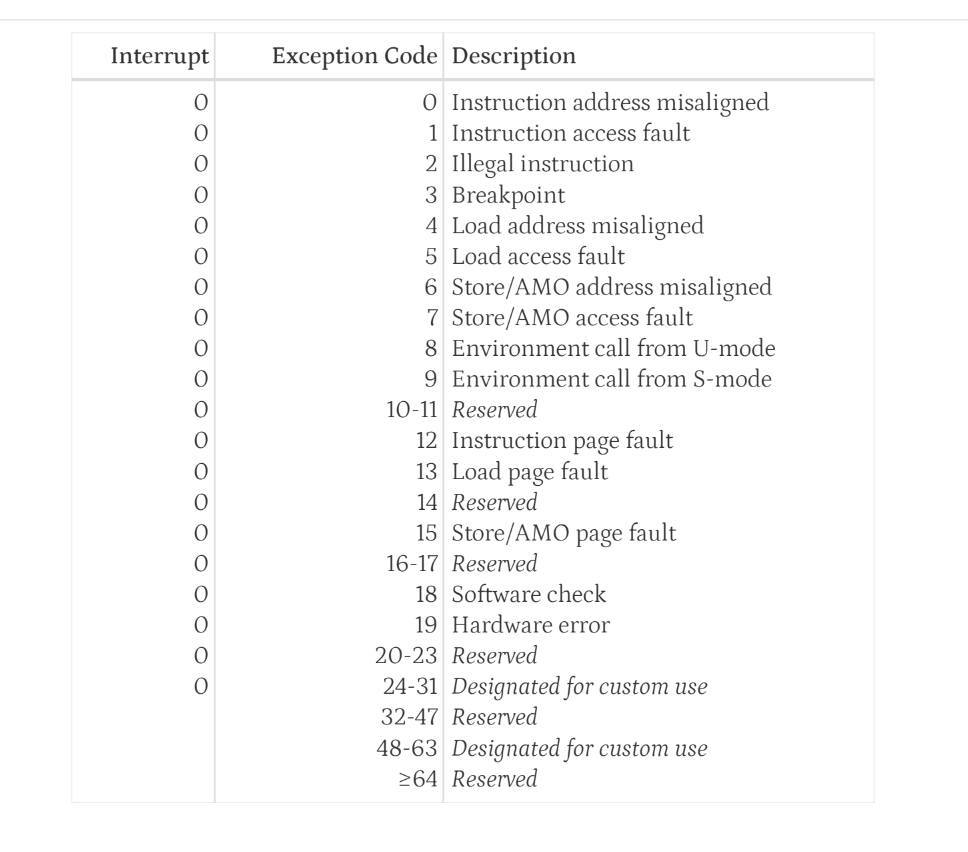
同时可以通过读取scause得到trap原因。
根据表格得知当尝试写一个COW page时产生的page fault exception Code 应该为15.
我的具体实现思路如下(但该思路实现目前存在bug, 会在执行usertests时在kernel trap里panic. 尚未查明原因。)
首先建立全局数组用于计数每页物理内存的引用数。数组大小为物理内存大小除以页大小。
uint64 cowcnt[(PHYSTOP - KERNBASE) / PGSIZE] = {0};
之后在kalloc分配物理内存时将该计数器置1。
共有两个位置会触发copy on write. 第一个是当用户尝试写一个PTE_W为0的PTE时,会进入usertrap. 需要在该位置分配新物理内存,将原先PTE uvunmap掉并mappages到新的物理内存。
第二个位置是copyout. 由于copyout是内核直接写用户的物理内存,因此不会触发usertrap, 需要单独处理。逻辑和usertrap对COW的处理一致。
cowcnt计数器的增减分别在uvmcopy中与uvmunmap中。uvmcopy在fork中被调用,原始行为为分配新内存并将原始内容拷贝到新内存,需要修改为将新PTE指向原始物理内存,并改变PTE_W标志位与COW标志位,之后将cowcnt计数器加1. uvmunmap会导致指向某个物理内存的PTE减1, 因此在其中将计数器减1.
kfree在释放物理内存时判断计数器大小。如果计数器大于等于1,证明仍有其它PTE指向该物理内存,不进行释放。